

This week I learnt and explored about:
Why diamonds may not be forever? On the structural decline of natural diamond demand and what that means for the industry
Observations on the new executive order regarding flag desecration in the U.S.
Chart of The Week #1: Is NVIDIA overvalued?
Chart of The Week #2: Why NVIDIA may not be overvalued!
Diamond Are (NOT) Forever - The Structural Decline of Natural Diamonds
Lately, I’ve been exploring the world of commodities — gold, coffee, cocoa… and now diamonds.
What pulled me in this time wasn’t a wedding registry or some great love story — it was a deal.
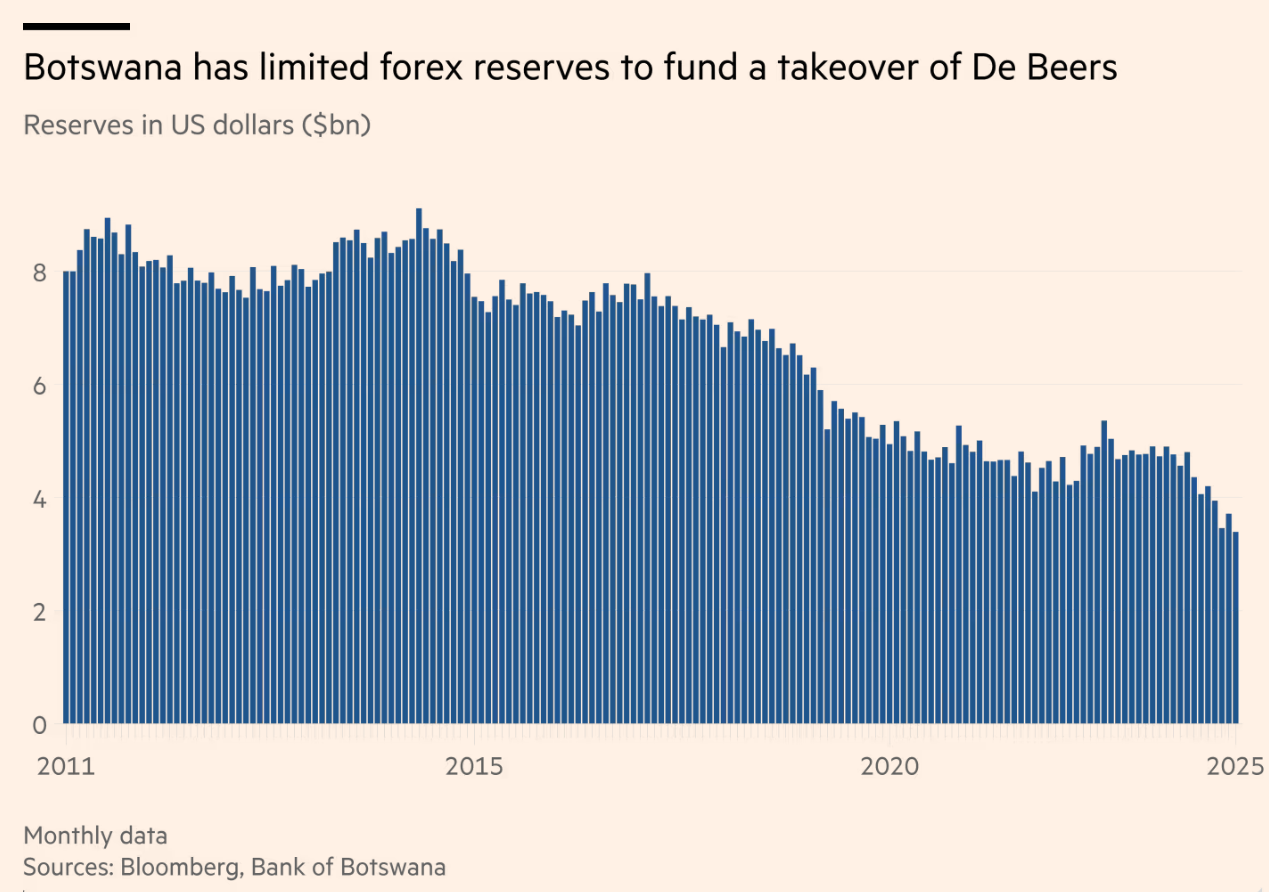
Anglo American, which owns 85% of De Beers, is preparing to sell the business. The remaining 15% is already held by Botswana, which has now hired Lazard to advise on a potential takeover — a move that would be supported by a $12bn capital injection from Qatar’s Al Mansour Holdings.
When news of Lazard’s engagement broke, it was also revealed that roughly nine bids had already been submitted for De Beers. Early indications suggest a distressed-sale dynamic, with offers clustering closer to the book value of the assets rather than any growth premium. For context, De Beers sits on Anglo American’s balance sheet at about $4.9bn — a figure that now looks closer to a ceiling than a floor.
Even at that discounted level, however, Botswana may struggle to finance a bid on its own. The country’s foreign exchange reserves have been eroded by the secular decline of the natural diamond industry (as explained in the rest of this blog), making a Qatari backstop not just helpful, but essential.
What piqued my attention and inspired this post is the deep tie between De Beers and Botswana.
Since 1967, their public-private partnership has underwritten the country’s rise — free healthcare, education, and poverty reduction on a scale rare for the continent. At its peak, diamond revenue elevated Botswana to the ranks of just seven upper-middle-income African nations, with poverty rates falling from 59% in 1985 to 16% by 2015.
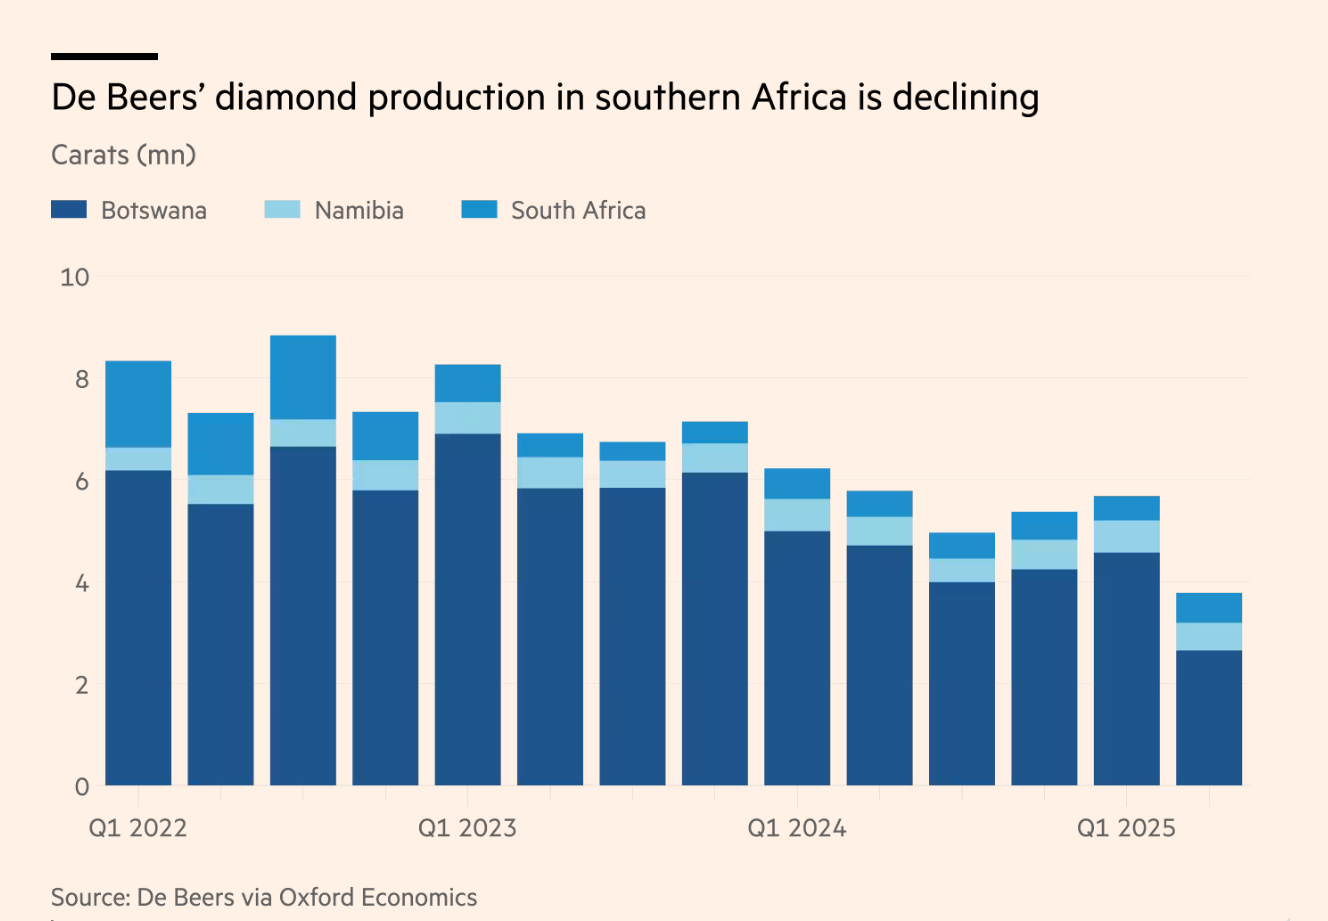
But that story is now under stress. Diamond revenues fell by half in 2024, dragging GDP down 3% and helping usher in President Duma Boko, Botswana’s first leader outside the Botswana Democratic Party since 1966.
Botswana’s political turmoil and Anglo American’s decision to part with De Beers is a reflection of how fragile the economics of diamonds have become, with prices of natural diamonds in secular free fall.
De Beers has long been a symbol of eternal love (and prestige). After the Great Depression, its marketing team coined the phrase “A Diamond is Forever,” cementing the stones as markers of eternal love and cleverly discouraging their resale. Today, it supplies roughly a third of the world’s natural diamonds, most of them dug from Botswana’s soil. But the cultural positioning that once insulated De Beers now collides with a very modern threat: synthetics or Lab-grown diamonds.
Lab-grown diamonds (LGDs) — made in factories in India and China using high-pressure, high-temperature, and chemical vapor deposition methods — are chemically identical to mined stones. To consumers, they’re indistinguishable. To the natural diamonds industry and De Beers, particularly, they’re existential. De Beers booked a $189mn loss in the first half of this year as lab-grown engagement rings gained ground.
Creating lab-grown diamonds is significantly less expensive — about 80% cheaper than mining natural stones, and production costs are still decreasing.
That cost advantage gives retailers enormous flexibility. They could pass most of the savings on to consumers, but in practice, they don’t.
A diamond, even when grown in a factory, still carries “emotional” value, which means it can command a premium above its production cost. As a result, retailers keep much of the margin.
Consider the average American wedding budget: about $5,000 goes toward the engagement ring. That sum will only stretch to a modestly sized natural diamond. But put it toward a lab-grown stone, and it buys a rock three to four times larger. Even if the retailer prices the lab-grown option below the $5,000 mark, the consumer still walks away with a flashier diamond, and the retailer still enjoys a far healthier margin than on a mined stone. For both retailers and consumers, lab-grown diamonds present a win-win situation. Unfortunately, for others involved in the traditional value chain, this shift has been a losing scenario..
The change is not solely about pricing. The distinction in status diminishes when the premium product resembles the discount version. As Pandora and other mass-market brands crowd the market with $200 lab-grown rings, the perception of natural diamonds as luxury items continues to decline. Who would want to pay substantially more for a stone that looks the same as the one their coworker bought at the mall?
Nobody wants to be a “cheap” husband, but nobody wants to be the husband who overpaid for a stone indistinguishable from costume jewellery either.
The Diamond Market Structure
The diamond industry is unusual in commodity terms, given that it is overwhelmingly B2C, meaning end demand depends less on industrial necessity and more on consumer confidence, disposable income, and cultural tastes.
That makes it structurally more fragile than, say, oil or copper. The value chain itself has three nodes:
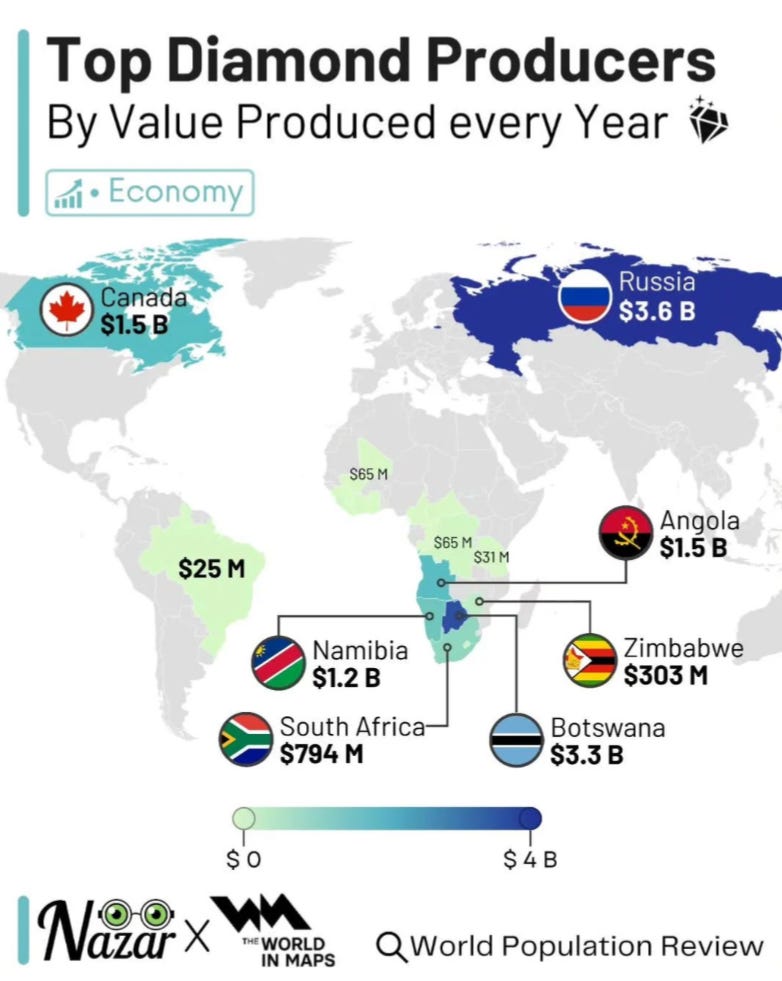
Upstream (Mining and Extraction) - There are only a few companies that participate in mining and the extraction of rough diamonds. De Beers and Alrosa account for ~50% of the supply by volume. The largest diamond-producing countries include Russia, Botswana, Angola, Canada, South Africa, and the Democratic Republic of Congo. Across this value chain, the supply of rough diamonds has fallen since 2006 and is expected to continue declining as open-pit mines become depleted, and making new investments is proving uneconomical under current trends in the broader industry
Midstream (Sorting, Cutting and Manufacturing) - The raw diamond is first sorted into either (a) an industrial-grade diamond or (b) a non-industrial-grade used in jewellery. Non-industrial grade diamonds account for almost the entirety of the diamond market by value. The sorted diamonds are then polished with ~90% of the polishers concentrated in Surat, India. These cut and polished diamonds are then set into jewelry by manufacturers who do not normally own their diamond inventory but rather work with either cutter-polisher or retailers
Downstream (Jewelry Retailers) - The final stage involves the sale of diamonds to consumers via high-end brands to online platforms. The major consumer markets are the USA (~50%), China (~25%), and India (~25%)
Next, to understand how value flows through the diamond chain, it’s worth looking at the way miners control supply.
Upstream players have a notorious reputation for managing scarcity, and miners such as De Beers enforce this through a system called “sights”. “Sights” are sales events where parcels of rough diamonds are offered to approved buyers, known as sightholders, at prices set by the miner.
About ten times a year, sightholders — largely Indian polishers — are invited to buy their full allocation under strict take-or-pay terms. The system guarantees a predictable offtake for miners, but it pushes risk downstream to polishers who can end up holding expensive rough diamonds during periods of weak retail demand.
In the natural diamond value chain, there are two key price points: miners sell rough diamonds at “sights” to polishers, and polishers get “polished prices” from retailers. The retailers will then incorporate these diamonds into final jewellery, add their marketing magic, and sell the end product at (extremely) high markups.
As you could imagine, the polishers are the weakest node in the value chain. On one side, they face a limited number of natural diamond suppliers — companies like De Beers, Alrosa, and Rio Tinto — which gives miners high bargaining power. On the other hand, their customers are retailers who buy in bulk and ultimately control access to end consumers. That makes retailer bargaining power equally high. Caught in the middle, polishers, most of them in India, have little ability to push back on rough prices set upstream or on polished prices dictated downstream, leaving them structurally squeezed when demand turns soft.
And that dynamic is a natural segue into understanding why prices have collapsed in recent years.
Why Diamond Prices Have Collapsed Recently
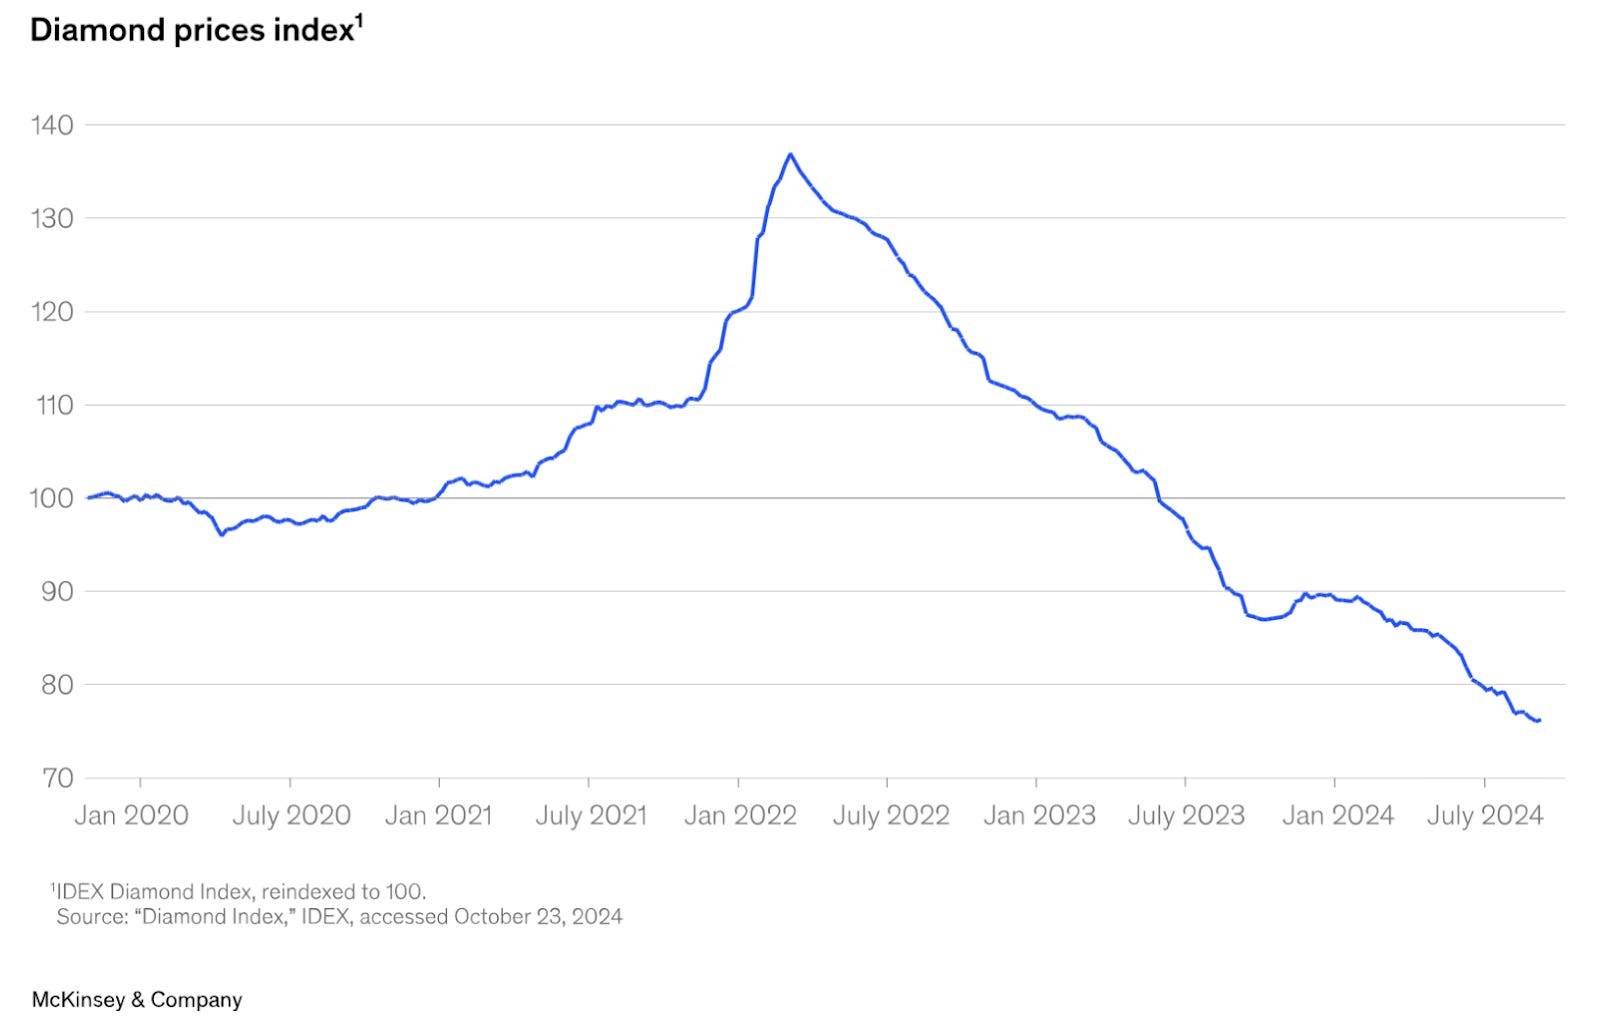
Unlike gold, coffee, or cocoa, diamonds are not exchange-traded commodities. Pricing is opaque, negotiated through networks of miners, polishers, and retailers rather than on open markets. The most widely used benchmark is the Rapaport Diamond Index (RAPI), which tracks asking prices for polished diamonds across categories. Below, I’ve shown an annotated 1-carat RAPI index for polished diamond prices and inventory levels, to show how the industry’s dynamics have played out recently.
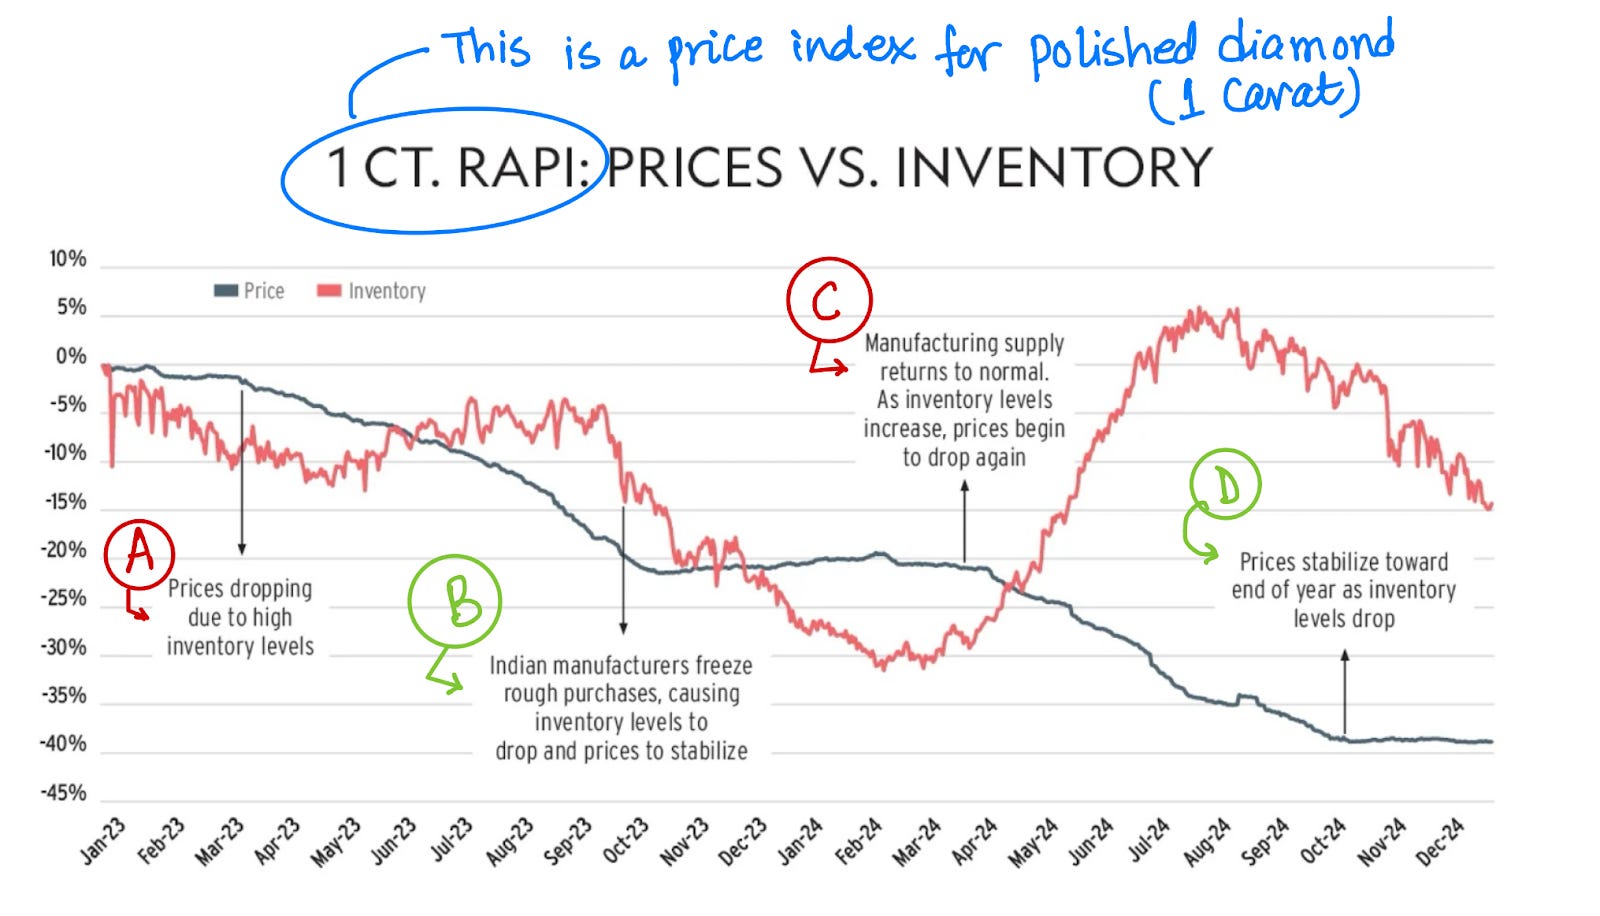
A — Prices drop due to high inventory
Coming into 2022, retailers had stockpiled polished stones to shield themselves from the wild swings in rough prices seen during COVID. But by late 2022, demand softened sharply — driven by China’s slowdown and the growing penetration of synthetics. With polished inventories already elevated, the market tipped into oversupply and prices fell.
B — Indian polishers freeze rough diamond purchases
As margins collapsed, Indian polishers — who dominate the midstream and are usually bound by long-term sight obligations — collectively froze new rough purchases to stem further losses. That pause forced inventory levels to adjust downward and briefly stabilized prices.
C — Supply resumes, demand doesn’t
Once inventories had eased, manufacturing activity resumed. Indian polishers returned to buying rough stones, but the underlying problem remained: demand for natural diamonds never really recovered. As fresh, polished output hit the market in 2024, inventories swelled again, and prices resumed their decline.
D — Stabilization at lower levels
By late 2024, inventories finally began to contract from their bloated levels. Prices found some stability, but only at a significantly lower base — reflecting the structural demand erosion natural diamonds now face.
So What Does the Future Hold For the Natural Diamond Industry
All of this brings us to what I believe is the core problem with the natural diamond industry, and why I lean bearish.
Unlike coffee or cocoa, where cyclical forces eventually trigger mean reversion, diamonds face a secular headwind: the threat of substitution and shifting consumer preferences.
Consumers are either (a) opting for lab-grown or (b) preferring other luxury goods and experiences over diamonds. In my opinion, without a marketing revolution on the scale of “Diamonds are forever,” the industry risks sliding into long-term decline.
That said, what makes me bullish is seeing a successful re-differentiation of natural diamonds from lab-grown — a revival of their cultural appeal through innovative marketing, perhaps even by opening new markets. Today, roughly 75% of natural diamond demand comes from just three countries: the U.S., China, and India. If the industry can spark demand beyond this core, or convince consumers once again that a natural diamond is something uniquely desirable, then the story could look very different. For Botswana, for De Beers, and for Anglo American’s bankers, that remains the big unknown: whether the shine can be put back on.
Reading list if you are interested in digging deeper
Flag Burning / Desecration Laws Across Countries (An Update)
I had previously written about a correlation I noticed between flag desecration laws in different countries
“Free speech purists like the US and Canada would be outliers in protecting flag burning, while more traditional societies would criminalize it… I think these laws reveal less about patriotism and more about how different societies balance domestic free expression. Some countries prioritize national honor, others diplomatic pragmatism, and a select few treat flags as fair game for political protest.”
On June 21, 2025, I wrote this, and since then, the following events have unfolded. What does this indicate about the trajectory of free expression in the US?

Chart of the Week # 1: Is NVIDIA Overvalued?
NVIDIA is bigger than the French (CAC) and German (DAX) stock markets
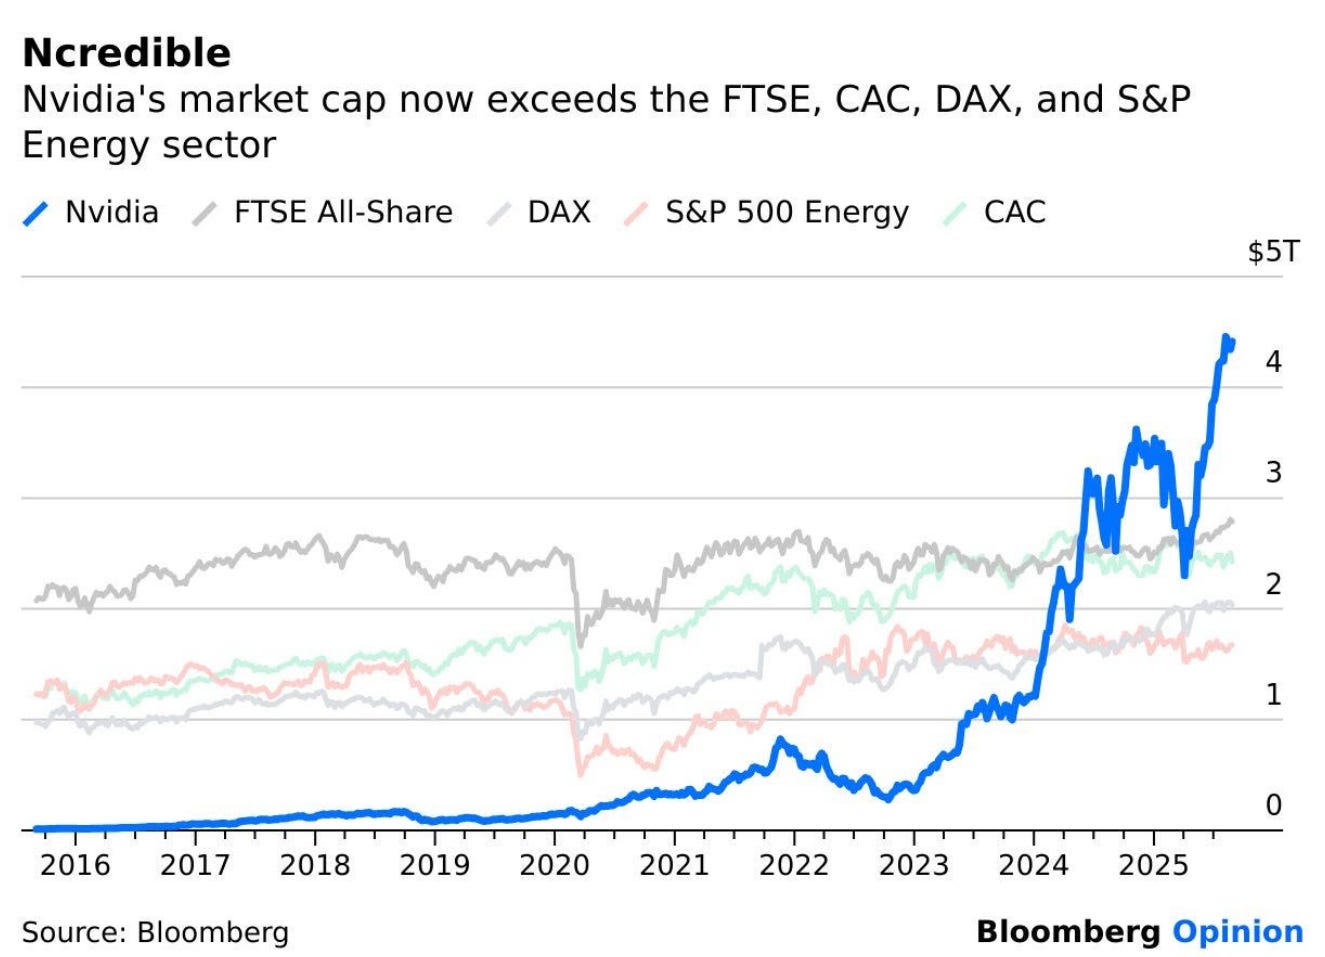
Chart of the Week #2: Maybe NVIDIA is Not Overvalued!
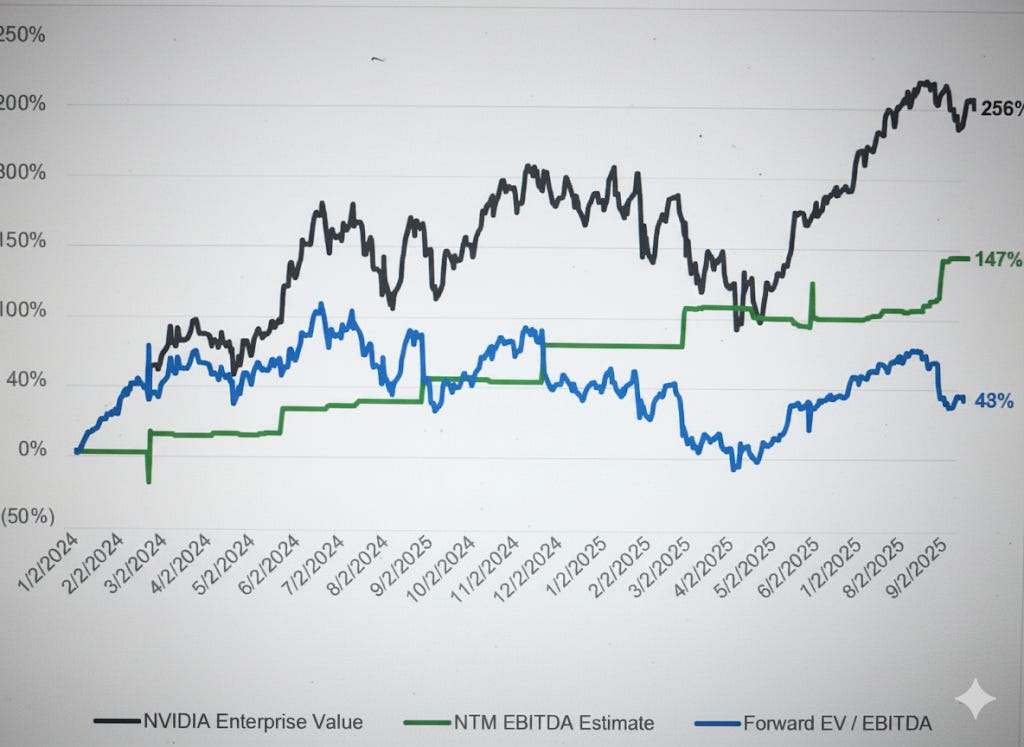
Saw the chart above and wanted to know how much of NVIDIA’s run-up is sentiment vs. fundamentals, so I did some quick back-of-the-envelope math.
The move in enterprise value (EV) can be decomposed into two pieces:
(1) the change in the forward EV/EBITDA multiple (multiple expansion) and
(2) the change in the forward/next twelve-month (NTM) EBITDA estimate (company fundamentals)
Multiple expansion ≈ investor sentiment;
EBITDA revisions ≈ company fundamentals.
Since Jan 1, 2024, NVIDIA’s NTM EBITDA is up ~147% while the forward EV/EBITDA multiple is up ~43%.
Together, that implies roughly a +250% lift in EV.
Translation: fundamentals did the heavy lifting; this isn’t just a bubbly froth of investor sentiment.
Even at record highs and with the inevitable “bubble?” headlines everywhere, there’s an arguably rational, fundamentals-first case explaining a good portion of NVIDIA’s meteoric rise.
That’s all for this week folks. See y’all next week!