Why is Coffee So Expensive, U.S. Population Growth and Immigration, Good and Bad Chart of the Week…
Notes From My Weekly Feed # 12

Why Your Coffee Got Expensive and What Happens Next
This week, my feed was filled with interesting information on a few commodities - namely, coffee, chocolate and tomatoes - things I have not spent enough time thinking about but things that have been in the news lately for different reasons. Coffee and cocoa for historically high prices and tomatoes for tariff related reasons.
I wanted to do a deep-ish dive into each commodity. And so for this week’s post, I’m writing what I learnt about coffee, why the prices are as high as they are and as a result why it's in the news.
The TLDR is that Coffee is a two-country, two-bean market; three signals predict price: Brazil’s weather, Vietnam’s rainfall, and ICE certified stocks (one measure of coffee bean inventory and therefore “supply”). Of course there are other factors such as the value of Brazilian currency (Real) but I'm aiming to keep this discussion a bit high-level that helps create a mental model for price action in the coffee world.
First some coffee basics.
Like oil, coffee — or more specifically, coffee beans — are a commodity that trades on global exchanges, with a market price that ultimately trickles down into what you pay for your morning latte.
Here is a 10-year chart of coffee prices - and the prices have been going up - and hence so much news around it!
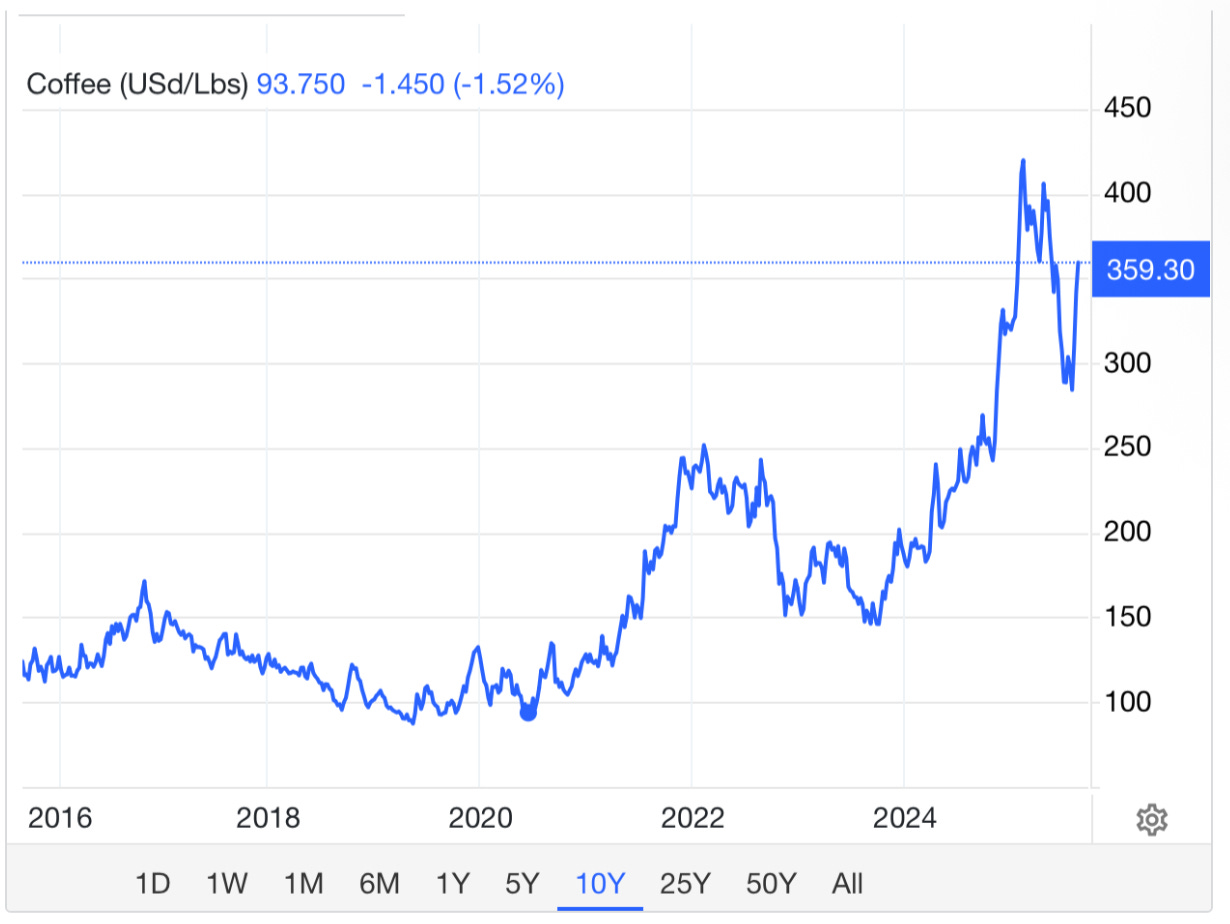
The price above is for Arabica, which makes up ~60-70% of global coffee production. The rest is Robusta, often blended with Arabica in varying ratios to make your morning Joe.
And roasters can substitute between Arabica and Robusta as and when one becomes more expensive than the other.
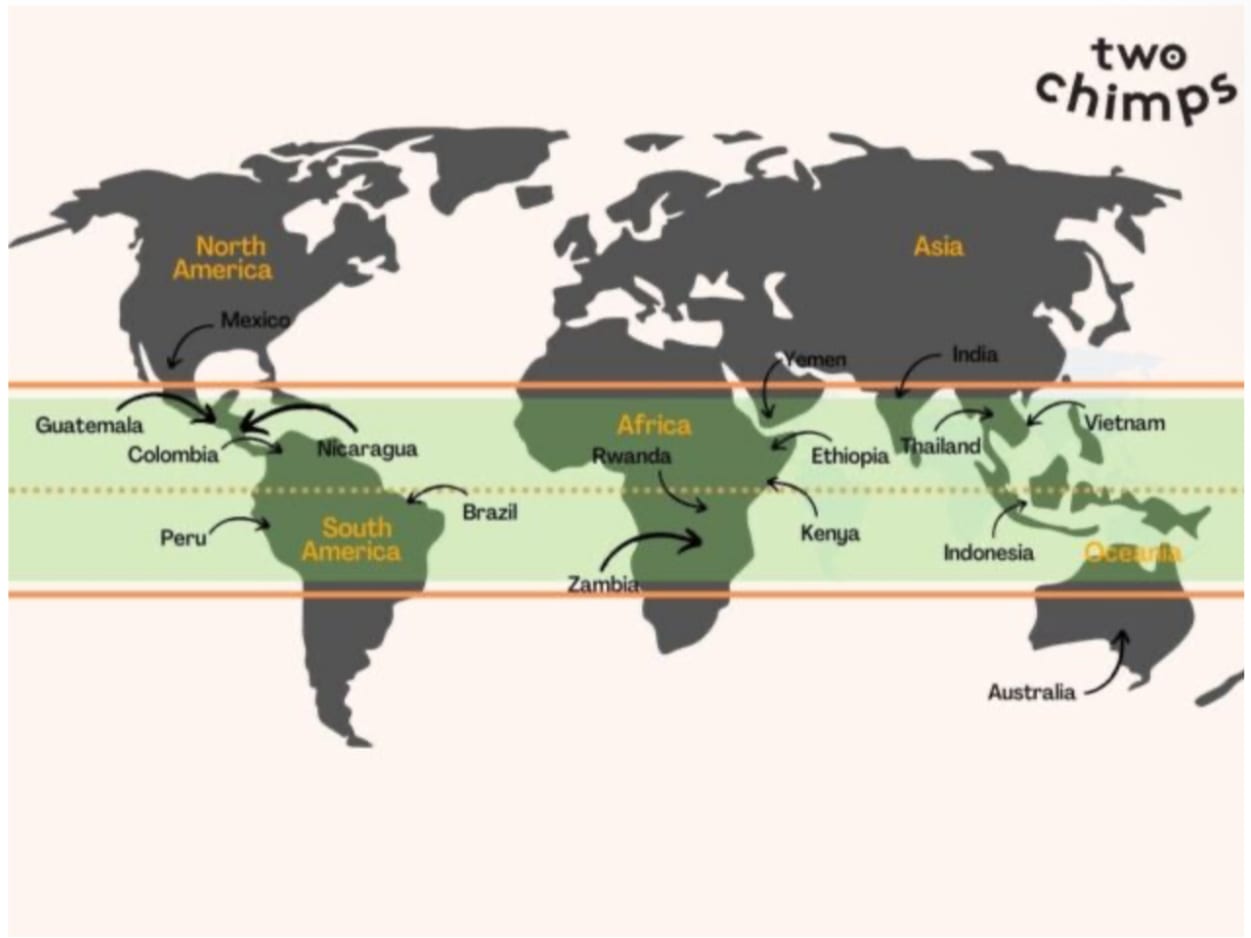
Coffee production is ideal in warm climates close to the equator - the region between 30 degrees north and 25 degrees south of the equator - is thus also called the “coffee belt” - the ideal region.
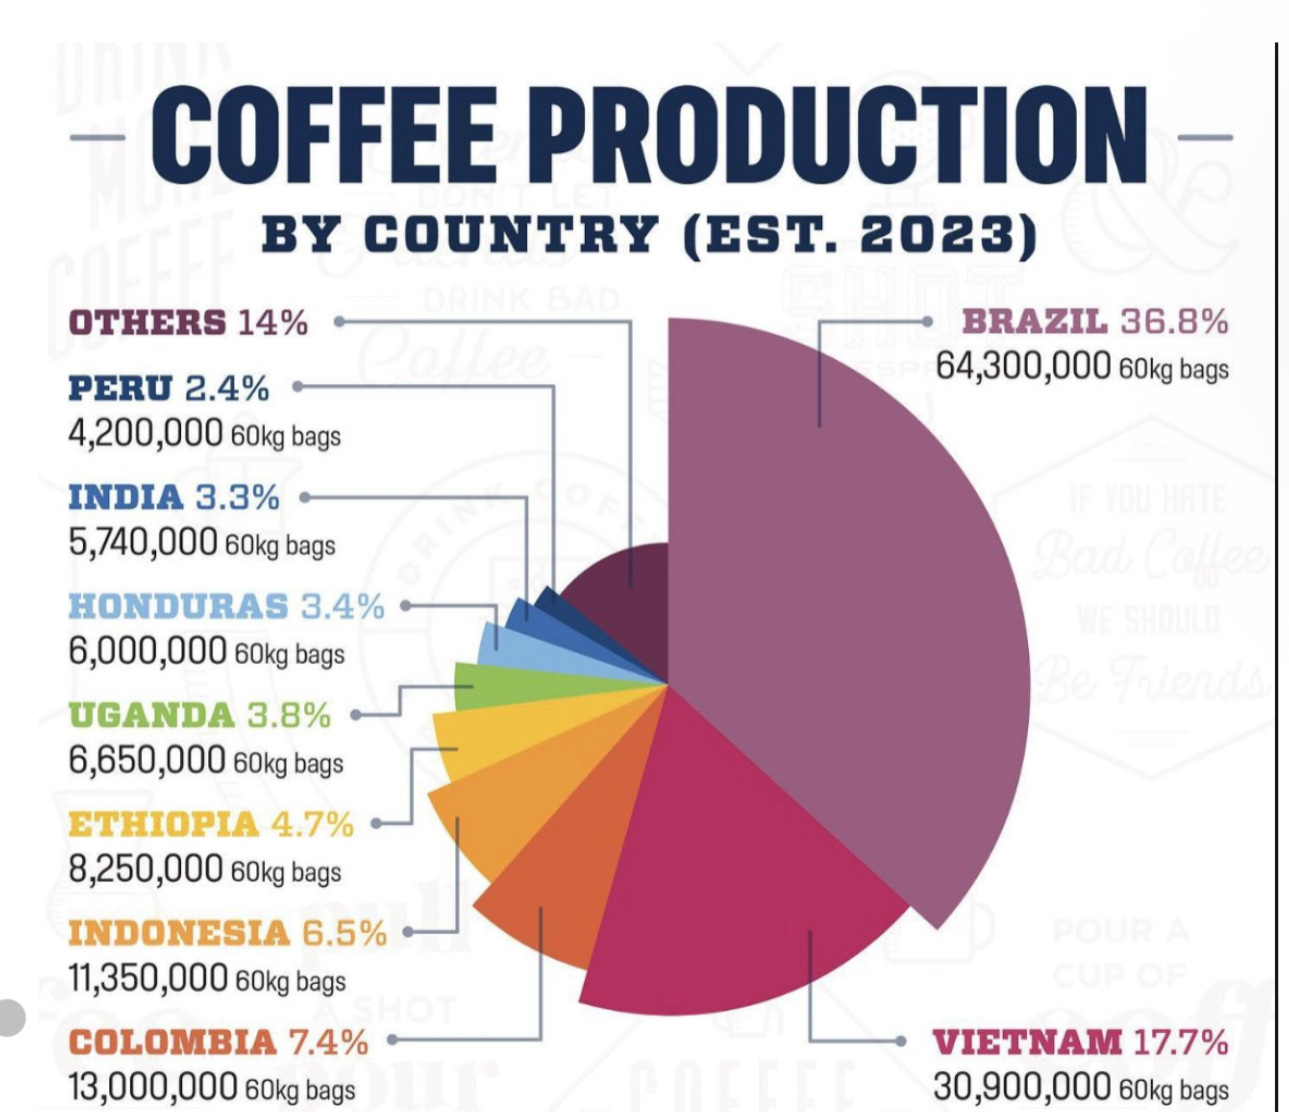
Brazil and Vietnam are the heavyweights, together accounting for over 50% of global production. So, you could say, Brazil and Vietnam are to coffee what OPEC is to oil. And while Brazil mainly produces Arabica, Vietnam almost exclusively produces Robusta.
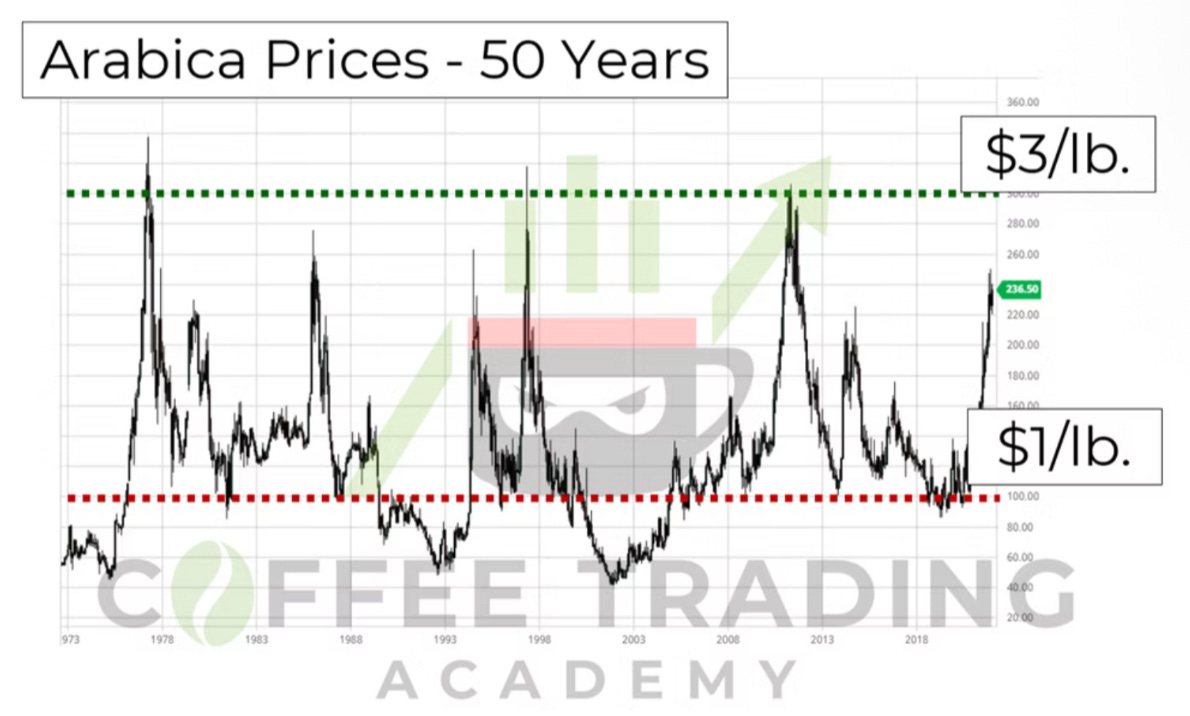
As shown in the chart below, over a fifty year period, Arabica has generally traded in a tight window of between $1 - $3 / lb. The band holds because roasters can substitute toward Robusta when Arabica gets expensive, which cools demand for Arabica. When prices fall and futures sit above today’s price, traders and exporters are rewarded to store beans, so a bit less coffee hits the market right away and prices stabilize.
But what’s out of control of roasters / traders / exporters is the weather.
It’s the weather in Brazil / Vietnam that dictates what coffee supply looks like in any given year. A drought or frost in Brazil and dry weather in Vietnam and the coffee crop yield drops, supply tightens and prices jump until harvests recover and inventories rebuild.
So what has led to the surge in coffee prices? I will try explain that with this annotated chart.
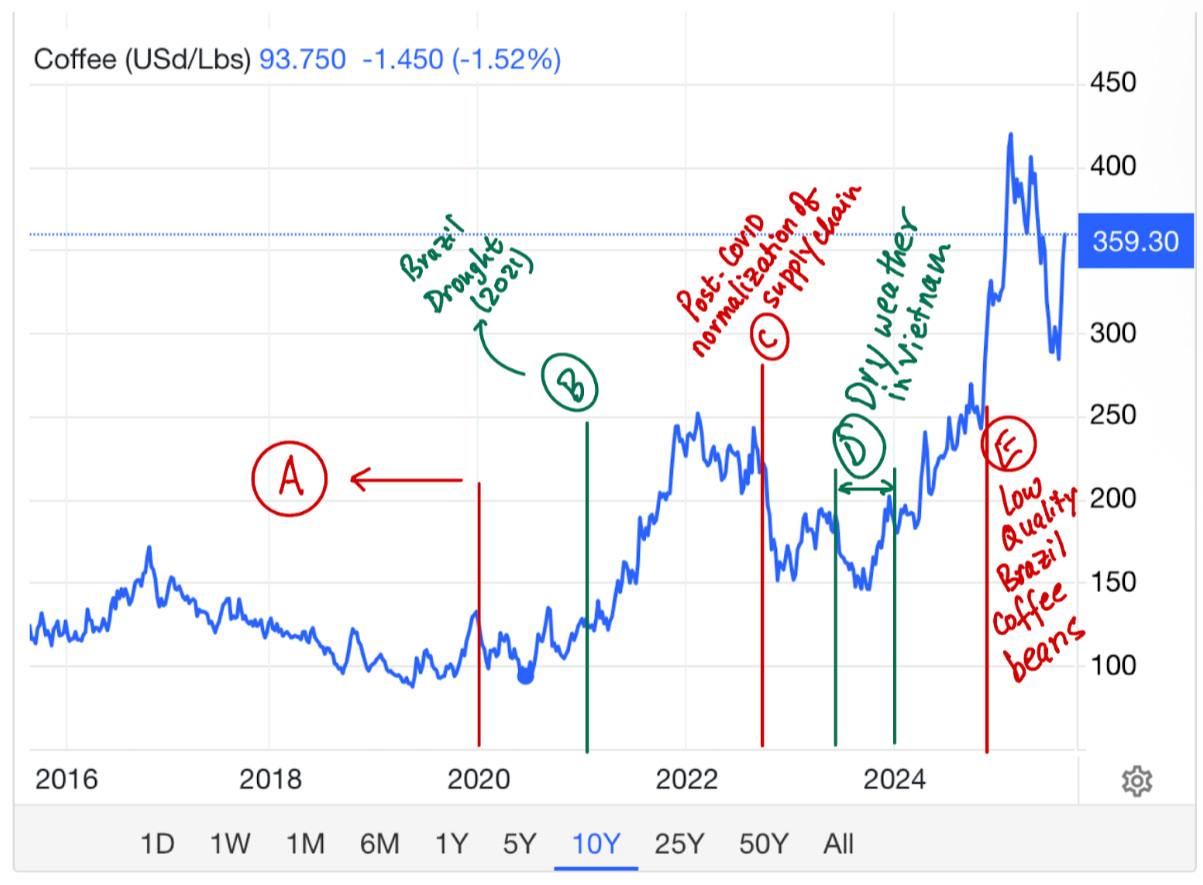
The events below are annotated for the letters on the commodity price chart above.
A: Leading into 2020, harvests were strong and inventories comfortable—classic “glut” conditions that kept Arabica near the lower half of its long-term range. COVID shifted demand from cafés to at-home brewing and snarled global logistics, but on balance fundamentals were still benign.
B: In 2021, Brazil—the swing supplier in Arabica—was hit by a severe drought during the maturation/flowering phase, cutting yield potential and thus affecting supply. Brazil’s exports fell, warehouse stocks were drawn down, and prices climbed.
Tight Arabica also pulled a lever on the other bean i.e. Robusta. Roasters substituted toward Robusta to protect blends, which tightened Vietnam and other Robusta regions. Think of it as a see-saw: when South American Arabica is short, Robusta demand rises.
C: As supply chains normalized through 2023, prices cooled but never fully reset because stocks remained lean.
D: Then, from late 2023 into 2024, the driver flipped: Vietnam’s dry weather cut Robusta output, so roasters leaned back toward Arabica, accelerating inventory drawdowns on Arabica and lifting prices again.
E: Compounding it, Brazil’s 2024 beans skewed smaller. Smaller sizes often go to lower-grade uses and can miss deliverable specifications established in contracts between exporters and purchasers. Fewer deliverable-grade bags means a tighter futures market, which amplifies price moves.
Net result: a two-bean squeeze—Brazilian Arabica stress + Vietnamese Robusta stress—on top of thin stocks. That’s how the market punched above the historical $1–$3/lb band and printed $3.50+.
So what’s next for coffee prices?
Depends on again - weather.
Brazil: Coffee is a biennial crop, meaning in general a good harvest year is followed by a bad one and the bad one by a good one.
But the recent surge is due to the fact that Brazil had several below-trend harvests and weather interruptions since 2021. But if business-as-usual in weather patterns return this year expect prices to fall. However, if the weather is disappointing again, Vietnam will play a key role in determining how high the prices go.
Vietnam: A dry weather leading into 2025 has curtailed the ability of roasters to substitute Arabica for Robusta. If Brazil has bad coffee weather but Vietnam has good coffee weather, Arabica prices may still go up but not as exorbitantly.
Here is a 2x2 matrix of what the “coffee weather” may do to coffee bean prices.
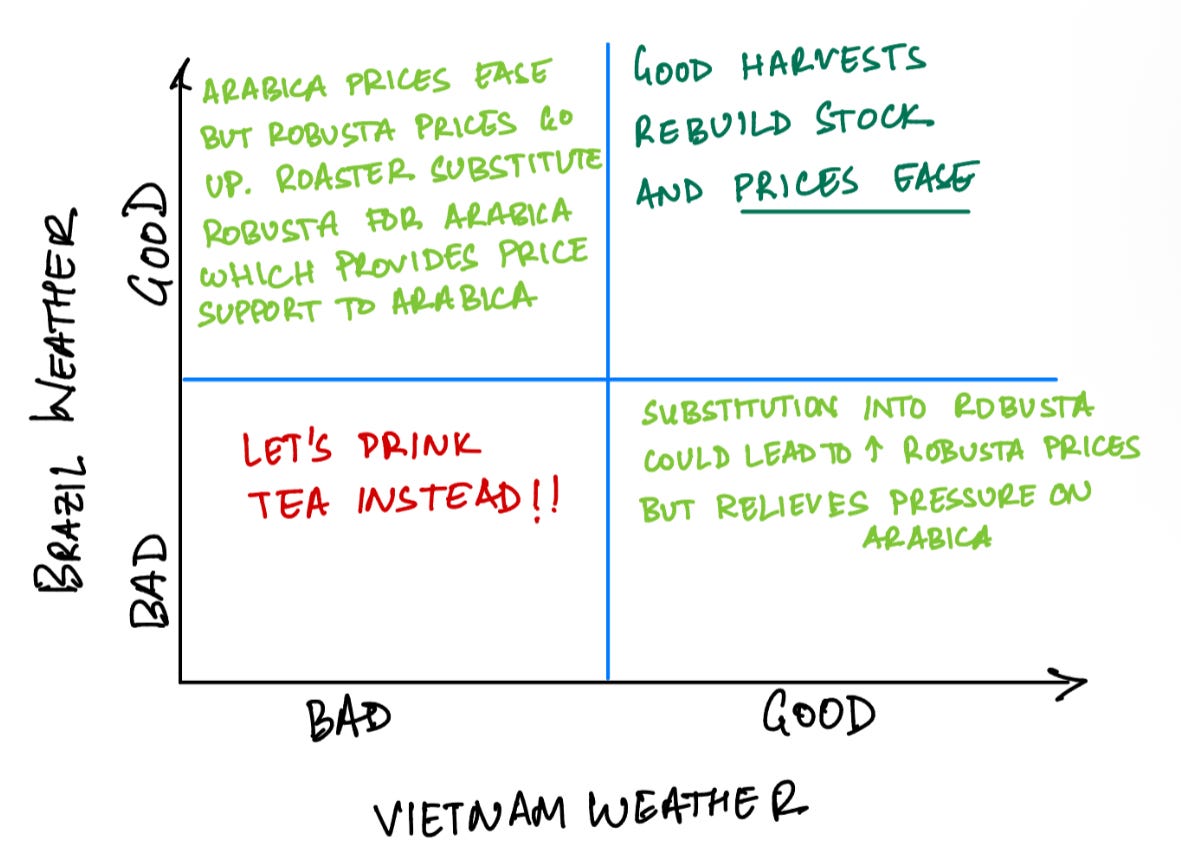
Bottom line: coffee is a Brazil-and-Vietnam story. If Brazil’s next Arabica harvest normalizes and Vietnam gets decent rain, expect prices to settle as warehouse stocks rebuild. If either leg stays stressed, the market stays tight; if both wobble at once, we’re back in two-bean squeeze territory with $3+ sticking around.
I’ll watch three things — Brazil’s weather, Vietnam’s rainfall, and ICE certified stocks — and (may) update this chart when any of them break the trend.
Cool References I Found During the Course of My Research:
Nice website for macro indicators: MacroMicro
Blog on Coffee Trading: Coffee Trading Academy
Most of the Recent U.S. Population Growth Came from Immigration
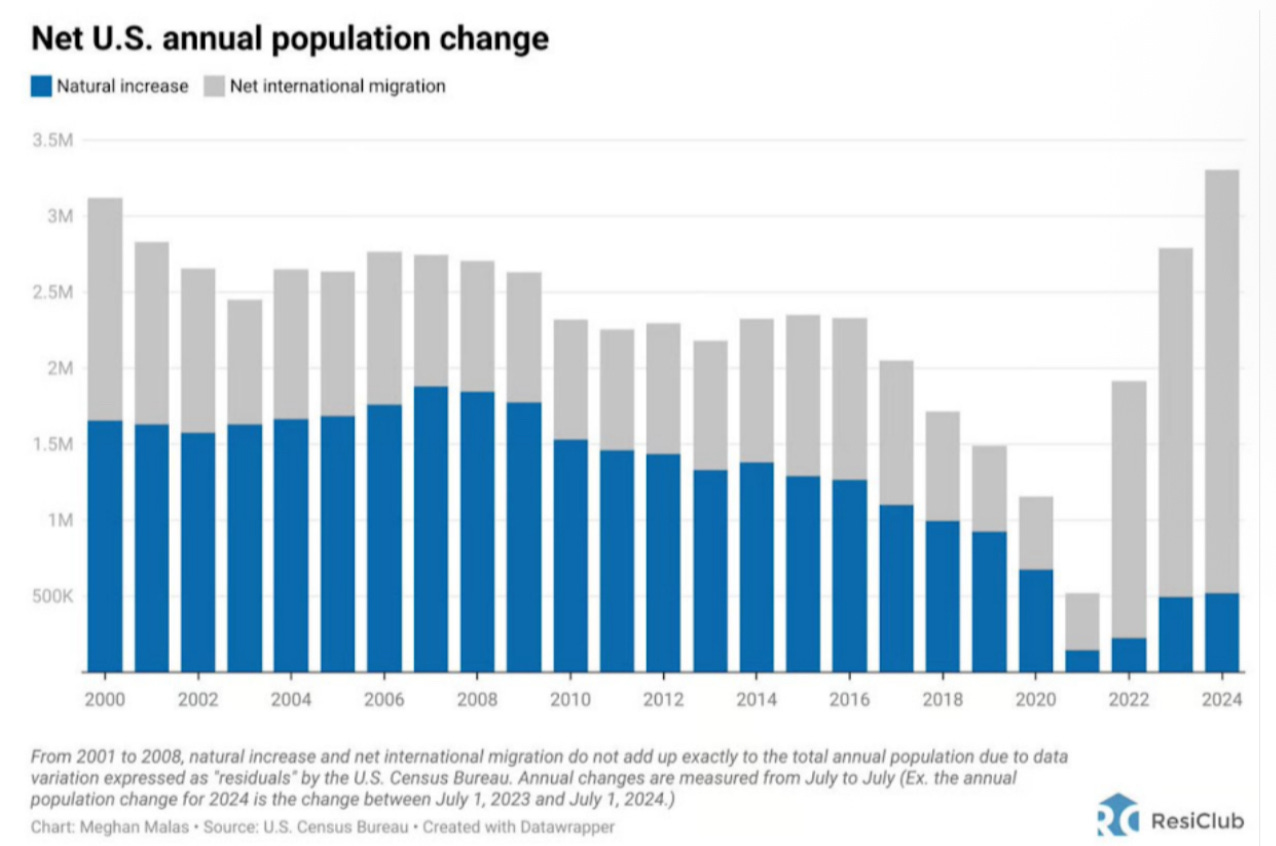
I had previously written about my thesis regarding the crucial role immigration may play in addressing the U.S.' fiscal deficit in light of concerning demographic trends. The summary from that prior post is below.
We know the US has a fiscal deficit problem.
We can either (1) reduce spending - politically unthinkable (2) raise taxes - politically suicidal (3) boost productivity - the current golden ticket
But productivity alone isn’t enough. It needs to be paired with rising demand. And if our population isn’t growing, we either need immigration… or global economic integration… or both.
Based on the chart above, the U.S. population growth in the past few years, primarily came from immigration. Unfortunately, by cranking down on legal immigration this and / or future administrations may turn off the spigot for one of the most crucial levers that the U.S. has to pull itself out of the (potentially) impending fiscal deficit crisis.
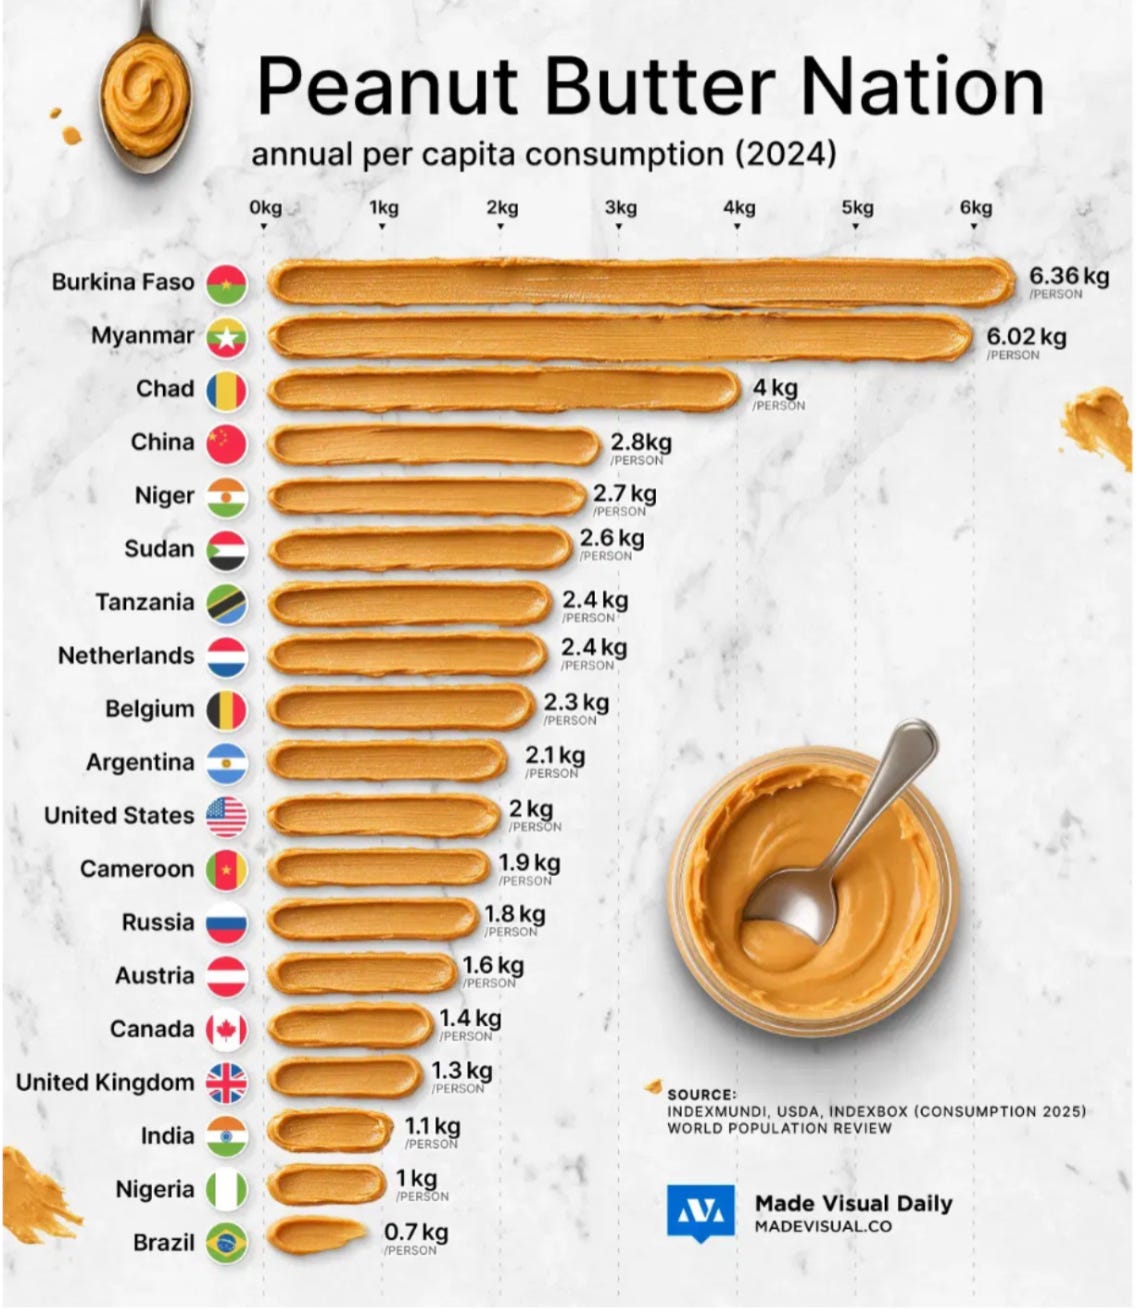
Chart of the Week: Peanut Butter Nation
I bet you would have never been able to guess that the top 3 countries by peanut butter consumption per capita. At least, I was surprised.
Looks like peanut butter is used as a base to cook many dishes in West African countries. It’s not the same sweetened jarred spread available in the U.S. but rather peanut paste i.e. the jarred peanut butter without the sugar and preservatives.
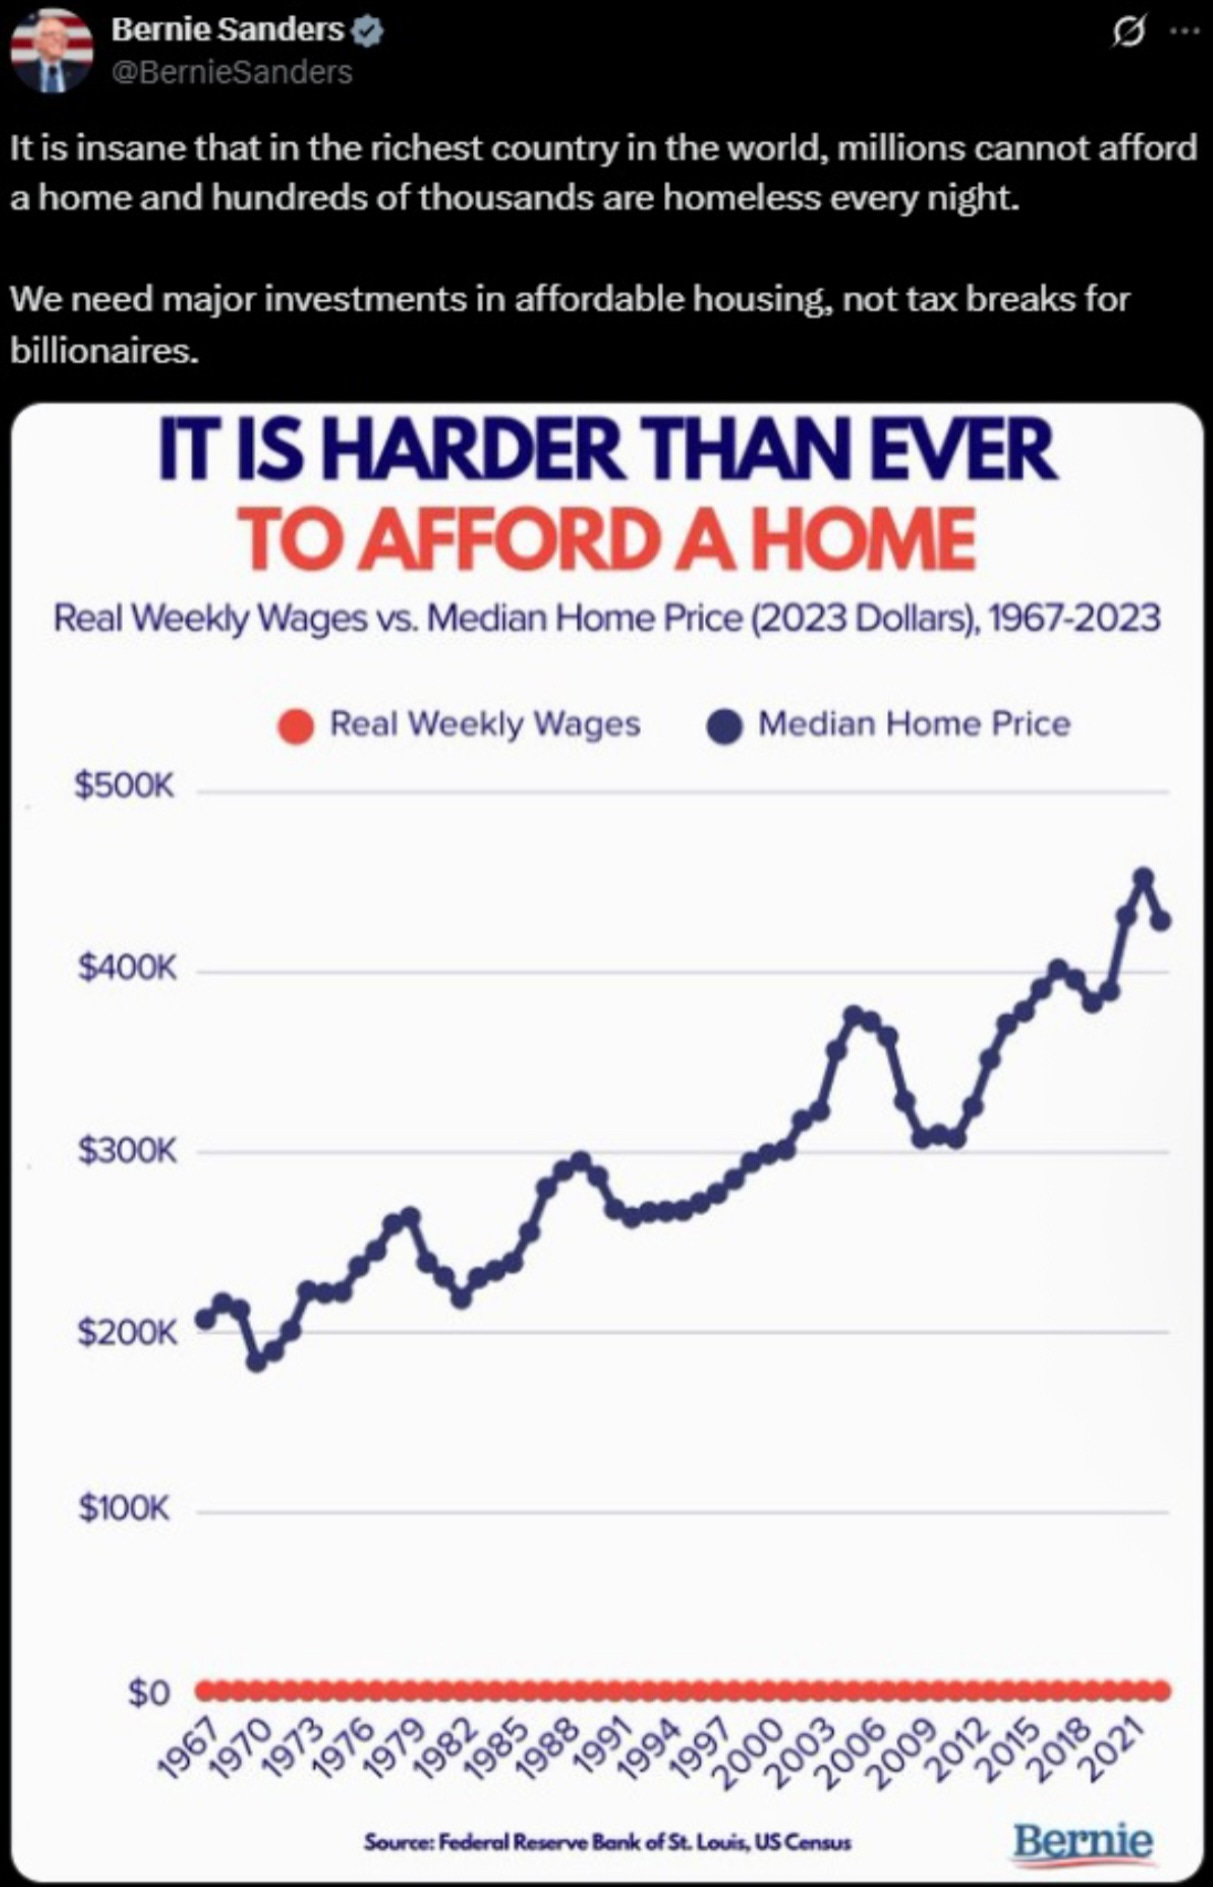
Bad Chart of The Week
Oh Bernie, Bernie!
I don't even need to elaborate on why this is a ridiculous chart meant only to propagate a narrative that fits your agenda while leaving all charting logic behind.
Economist and Substack generalist Noah Smith (Substack) did a better job, than I could have, of expressing concern with folks who “fudge” numbers to justify existing innate biases rather than revise their thesis based on real data.
While the drop in housing affordability over the past half century is certainly a problem, it’s not the kind of crisis that Bernie paints it as. Using silly charts in service of alarmist narratives ultimately just weakens trust in your movement — or at least, it should.
Well, that’s all for this week folks. See y’all next week.